Real time · Price Action indicator
See price action right on the chart — decide in time
Ten Price Action candle patterns appear on the chart as soon as the signal candle closes, on the daily and 4H timeframes. A pattern only counts when it appears exactly at a level of the published strategy and in the scenario's direction.
Open a free accountNew to reading candles? Learn free: Price Action Basics

Real examples from the sealed PA ledger
Finished cases scored by the system — wins and losses alike.
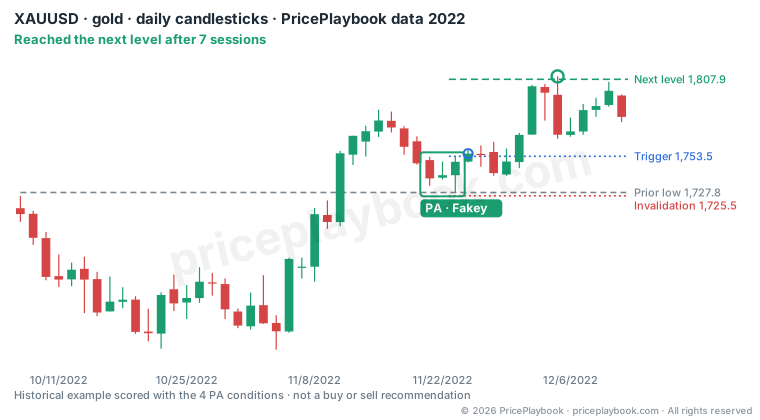
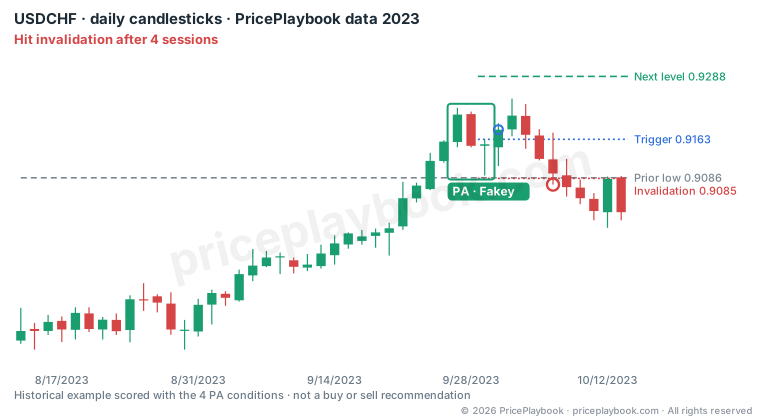
- Four condition boxesAt a level · same scenario · triggered · reward-to-risk of 1,5 or more — only all four together make a signal worth considering.
- Sealed PA ledgerEach pattern is recorded when the signal candle closes and chained by hashes — never edited, never deleted.
- Wins and losses both recordedReached the next level, invalidated or expired — all are scored and kept for you to check.
- On your chartPA labels appear right on the chart in the Analysis center; hover to see the pattern.
Start for freeOpen an account to use the free tools right away — upgrade when you need to. No card required.
Open a free accountAnalysis tools and reference data — not investment advice. Leveraged trading can lose more than your initial capital. Past results do not guarantee future results.